EE2211 / EE2213 Exam Toolkit
A graphical interface for all EE2211 (Introduction to Machine Learning) and EE2213 (Introduction to Artificial Intelligence) modules.
Quick Start
Option 1: Download EE2211_Exam_Toolkit.exe from the Releases page. No installation required.
Option 2: Run from source:
pip install numpy
python EE2211_GUI.py
Optional dependencies (already included in the exe):
pip install matplotlib sympy scipy
matplotlib+sympy: LaTeX rendering and cost function plotting in Cost Minimizerscipy: Linear Programming solver
Requirements: Python 3.7+, NumPy, Tkinter (built-in)
Modules
The GUI has 10 modules accessible from the sidebar. Each module has interactive matrix grids for input, a Run button (or Ctrl+Enter), and tabbed output (Summary, Iterations, Weights, Tree visualization).
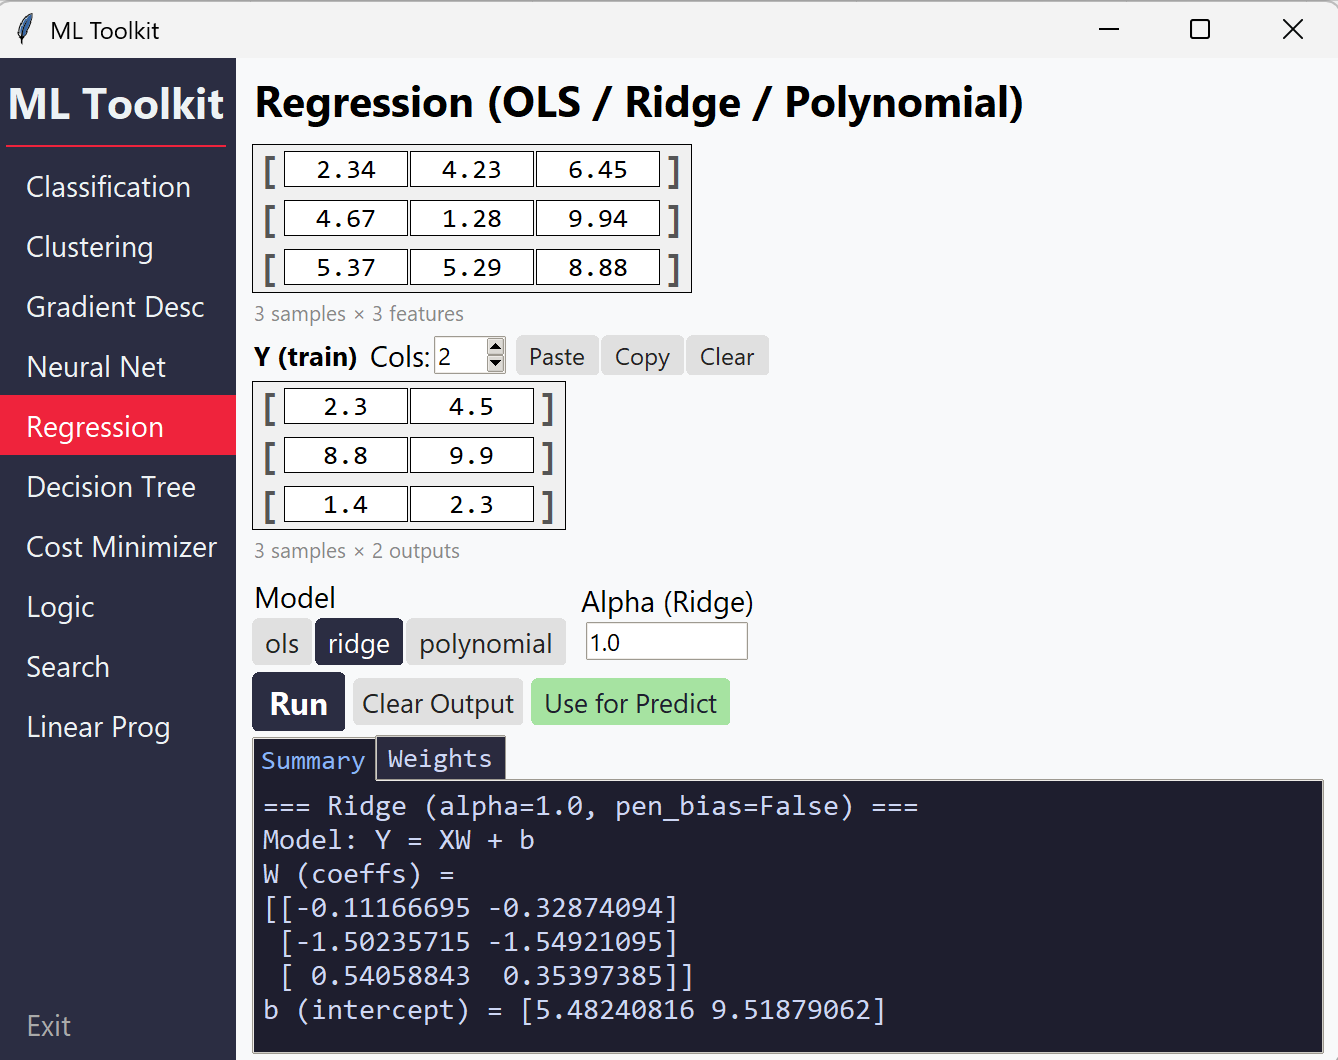
Regression (OLS / Ridge / Polynomial)
Solves linear regression problems with closed-form solutions.
| Feature | Details |
|---|---|
| OLS | Ordinary least squares with automatic intercept |
| Ridge | L2-regularized regression with configurable alpha and optional bias penalization |
| Polynomial | Feature expansion to any degree, then OLS/Ridge |
| Metrics | MSE, RMSE, MAE, R², Adjusted R², Pearson r |
| Predict mode | Supply trained W and b to predict on new X |
Input: X matrix, Y matrix, model type, alpha (Ridge), penalise bias toggle (Ridge/Polynomial), degree (Polynomial)
Classification (Logistic Regression)
Binary and multiclass logistic regression via gradient descent.
| Feature | Details |
|---|---|
| Binary | Sigmoid activation with configurable threshold |
| Multiclass | Softmax activation with one-hot encoding |
| Training | Full batch (GD), stochastic (SGD), mini-batch |
| Regularization | L2 lambda with bias penalization (on by default per EE2211/EE2213) |
| Metrics | Confusion matrix, precision, recall, F1-score |
| Weight init | Zeros, manual, or random |
| Extra settings | Batch type, batch size, momentum (via popup dialog) |
| Predict mode | Supply trained W to classify new X |
Input: X matrix, y labels, learning rate, epochs, L2 lambda, threshold
Gradient Descent (Linear / Softmax)
Step-by-step gradient descent showing every iteration’s computation.
| Feature | Details |
|---|---|
| Linear GD | Matrix-form gradient descent for regression |
| Softmax GD | Multiclass gradient descent with softmax probabilities |
| Per-iteration output | Shows Z (logits), P (probabilities), gradients, updated W |
| Options | Add bias column, 1/N scaling, 1-indexed labels |
Input: X (without bias), y, W0 (initial weights), learning rate, number of iterations
Clustering (K-Means / Fuzzy C-Means)
Iterative clustering algorithms with step-by-step output.
| Feature | Details |
|---|---|
| K-Means | Standard K-Means with manual initial centroids |
| K-Means++ | Smart initialization — specify K only |
| Fuzzy C-Means | Soft clustering with membership matrix, configurable fuzzifier m |
| Per-iteration output | Centroids, assignments/membership, objective value |
| Extra settings | Max iterations, convergence tolerance (via popup dialog) |
Input: X matrix, initial centroids (or K for K-Means++), fuzzifier m (FCM)
Decision Tree & Random Forest
Tree-based models for classification and regression.
| Feature | Details |
|---|---|
| Classification | Gini impurity or Entropy criterion |
| Regression | MSE-based splits |
| Modes | Root only (best split analysis), full tree, random forest |
| Random Forest | Configurable number of trees, max features (sqrt/log2/all) |
| Custom thresholds | Manually specify split thresholds per feature |
| Tree visualization | Interactive tree diagram in the Tree output tab |
Input: X matrix, y vector, task type, criterion, max depth, min samples
Neural Network (MLP)
Multi-layer perceptron with forward and backward propagation.
| Feature | Details |
|---|---|
| Configurable layers | Add/remove layers dynamically |
| Activations | ReLU, Sigmoid, Linear, Softmax, Tanh |
| Weight init | Zeros, Xavier, He, Random, Manual (with optional seed) |
| Loss functions | MSE, Cross-entropy |
| Output | Full forward pass, backprop gradients, updated weights per layer |
| Auto-sync | W matrix dimensions auto-adjust to match layer sizes |
Input: X (no bias), Y targets, layer configs (neurons, activation, init), learning rate, iterations
Cost Function Minimizer
Numerical gradient descent on arbitrary mathematical expressions.
| Feature | Details |
|---|---|
| Variables | Up to 5 variables (x₁ through x₅), inserted via blue buttons |
| Operators | +, -, *, /, ** (power), standard math functions |
| Functions | sin, cos, tan, exp, log, sqrt, abs, pi, e |
| LaTeX preview | Live rendered math preview (included in exe; requires matplotlib + sympy when running from source) |
| Math keyboard | On-screen buttons for operators and functions |
Input: Expression built with variable buttons, initial values per variable, learning rate, iterations
Note: Do not type variable names directly — use the blue variable buttons to insert x₁–x₅.
Propositional Logic
Truth tables, entailment checking, and equivalence testing.
| Mode | Description |
|---|---|
| Truth Table | Generate full truth table — multiple lines are auto-joined with AND (∧) |
| Entailment | Check if a knowledge base entails given queries |
| Check | Determine if an expression is a tautology, contradiction, or contingency |
| Equivalence | Test if two expressions are logically equivalent |
Operators: NOT (¬), AND (∧), OR (∨), IMPLIES (⇒), IFF (⇔)
Inserted via buttons or typed as ~, &, |, ->, <->
Propositions: A through H
Search Algorithms
Graph search with step-by-step exploration trace.
| Algorithm | Description |
|---|---|
| BFS | Breadth-first search |
| DFS | Depth-first search (with optional max depth) |
| Dijkstra | Uniform cost search |
| Greedy | Greedy best-first search (requires heuristic) |
| A* | A-star search (requires heuristic) |
Options: Graph search vs. Tree search
Edge format: One per line — FROM TO COST [b] where b marks bidirectional edges
S A 2 b
S B 3 b
A C 3
Heuristic format: S=6, A=4, B=3, G=0
A Load Example button populates a sample graph for quick testing.
Linear Programming
Solve linear optimization problems.
| Feature | Details |
|---|---|
| Maximize / Minimize | Toggle objective direction |
| Constraints | <= and >= inequalities |
| Non-negativity | Optional x >= 0 constraint on all variables |
| Integer variables | ILP mode for integer-only solutions |
Objective format: Space-separated coefficients, e.g. 7 2 6 for 7x₁ + 2x₂ + 6x₃
Constraint format: One per line
2 1 3 <= 14
-1 4 1 >= 3
UI Features
Matrix Grids
- Resize rows/columns with the spinners above each grid
- Y/y rows auto-sync with X rows when you change X’s row count
- Centroid feature columns auto-sync with X feature columns
- Neural net W dimensions auto-sync across the layer chain
Output Tabs
| Tab | Content |
|---|---|
| Summary | Key results, final metrics, and predictions |
| Iterations | Collapsible per-iteration details (for GD, clustering, etc.) |
| Weights | Trained weight matrices and biases |
| Tree | Interactive tree visualization (Decision Tree module) |
- Hover over the output area to expand it; hover over the input area to collapse it back
- Use for Predict button (Regression, Classification): auto-fills Predict mode with trained weights
Keyboard Shortcuts
| Shortcut | Action |
|---|---|
Ctrl+Enter |
Run the current module |
Tab |
Move to the next input box (including rows/cols spinners) |
Shift+Tab |
Move to the previous input box |